| Table of Contents | WiFi Hopper 1.2 User Manual |
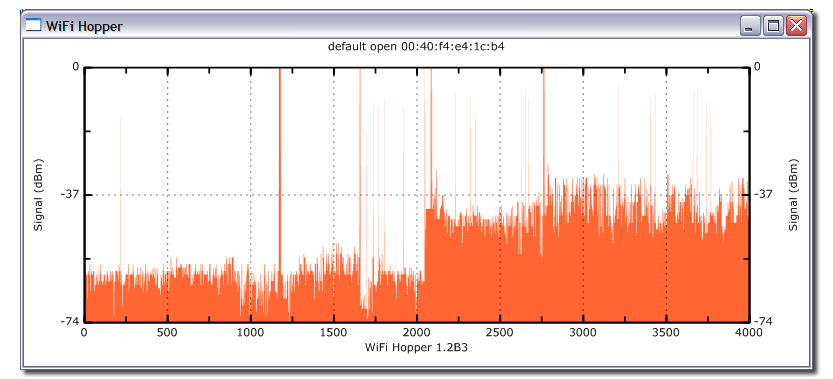
Signal Graph Window
The vertical scale of the graph plots the RSSI values of obtained from the wireless device. The horizontal scale of the graph represents the time in seconds since the graph was first launched. The graph uses auto-zooming so it may appear to be too zoomed-in or too zoomed-out in the beginning.
| Table of Contents | Last Updated on May 14, 2007 © 2007 Divya Thakur |