| Table of Contents | WiFi Hopper 1.2 User Manual |
Network Discovery and Site Survey Features
WiFi Hopper has a rich features-set to help those looking to perform a Site Survey or using WiFi Hopper for Network Discovery. The main features are outlined below:
Filter Operations
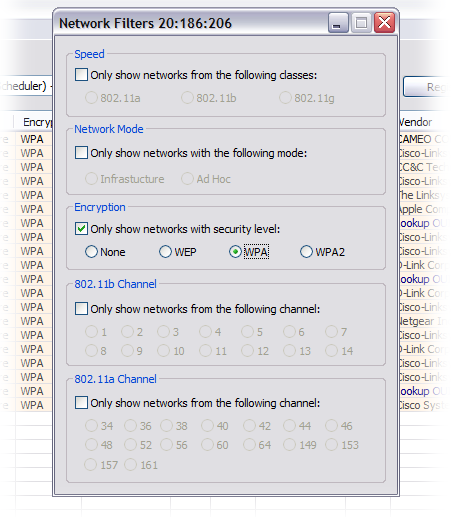
Result filters are enabled using the Filters Window. To launch the Filters Window, use the Apply Filters menu item.
The Filters Window can apply filters based on:
To apply the respective filter, select it in the Filters Window. The filtering is instantaneous and will affect the results shown in the Network List. The filter remains active even if the Filters Window is closed. The filtering options do not however, remain active between multiple application launches.
File Operations
WiFi Hopper supports four main file operations used to manage past network results:
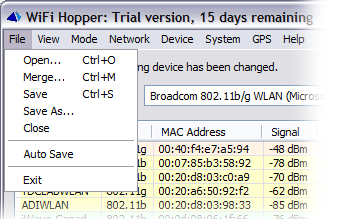
When opening previous results, WiFi Hopper stops scanning, clears current scanning results, and load the list of networks from the specified file. This mode is suitable for reviewing past scanning results.
When merging previous results, WiFi Hopper opens the previous results and merges the loaded networks with the current list of networks. This mode is suitable for building an incremental list of wireless networks.
When saving current results, WiFi Hopper will save the current list of network, including the ones that have been filtered out, into a specific file. WiFi Hopper can save files in native WiFi Hopper format, Network Stumbler NS1 format and Network Stumbler summary format. The last two formats are useful in collaboration with third-party tools like KNSGEM for GIS applications.
WiFi Hopper has an additional mode of operation enabled from File > Auto Save. In this mode, WiFi Hopper will automatically save the open file every 10 seconds (adjustable from the Auto Save Interval or the Options Window) ensuring that the most current list of networks is saved to file, in the event of an unexpected application crash.
WiFi Hopper can display a graph of RSSI values for a particular network over time. To access this graph, either:
You can choose to display graphs for multiple networks at the same time. The bottom scale of the graph is seconds since the graph was loaded. The graphs display negative values so some explanation is in order. Notice the graph below:
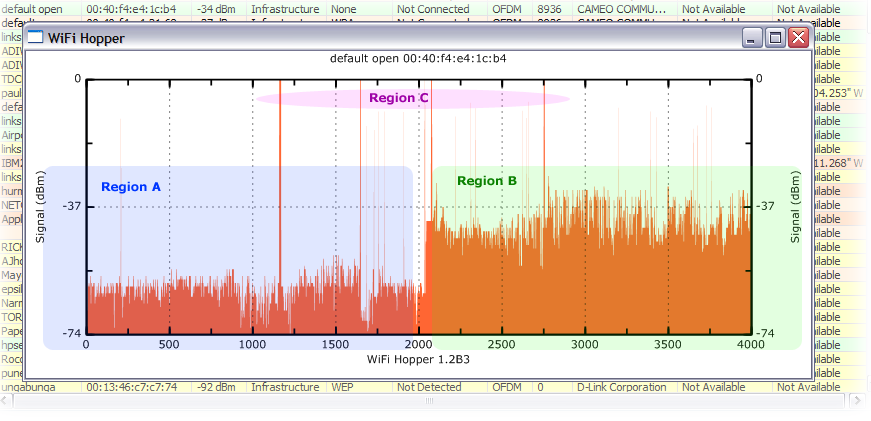
Graph region A indicates the period when the signal obtained form the graph was weak. This is because the peaks of the graph are low indicating a more negative value and consequently, weaker signal. Graph region B indicates the period when the signal was strong. This is because the peaks of the graph are high indicating less negative RSSI values, and consequently, stronger signals.
Finally, notice the long lines reaching all the way to 0 dBm, Region C. These lines indicate period when the network was not detected. A network which moves in and out or range a lot, may have a lot of these long bars in its graph.
Using GPS Device
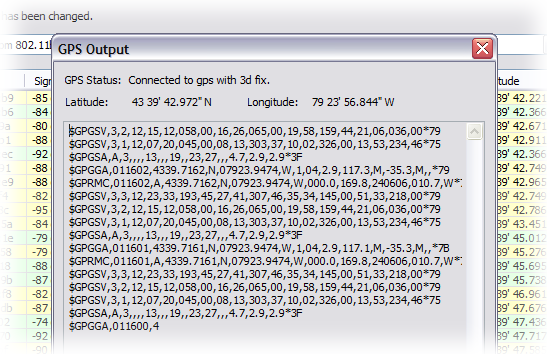
WiFi Hopper supports a GPS device that outputs data on a serial port in the form of NMEA 0183 sentences. To use a GPS device connect the device to a serial port on the system and ensure that the serial port settings are correct in COM Port and related options of the Options Window.
Once, the settings are verified, open the serial port using GPS > Connect To Serial Port from the Menu.
The Status Text will be updated to indicate the outcome of this operation. Once the serial port is opened, it is critical to ensure that GPS devices is communicating correctly with WiFi Hopper using the GPS Tester, before performing any other operations. Launch the GPS Tester from GPS > GPS Tester... The GPS Tester will indicate if the WiFi Hopper can communicate with the GPS device and will indicate the current latitude and longitude if a fix has been obtained. Either 3d or 2d fix are sufficient to determine the latitude and longitude for a given network.
Once the GPS is setup, the Site Survey operations can continue and WiFi Hopper will record the position for a network, when the highest RSSI value for that network is obtained. The latitude and longitude value of the network is available in the Network List. The Latitude and Longitude columns are not enabled by default and can be enabled either:
| Table of Contents | Last Updated on May 14, 2007 © 2007 Divya Thakur |